Project

Context
The D3M project aims to address the current challenge of democratizing the access to independent data sources to gain deeper analytical insights via automatic data integration and domain-specific decision making.
The proposal builds upon two research assets previously developed by our research teams, namely Generation and Evolution of Smart APIs (GENESIS), a dataspace management system (hereafter referred to as ODIN), and a software analytics tool (hereafter referred to as Strategic Dashboard).
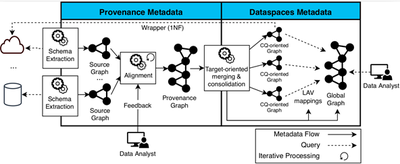
ODIN (On-demand Data INtegration) is a dataspace management system grounded on knowledge graphs. It is conceived to overcome the limitations of traditional virtual data integration in large-scale scenarios. ODIN automatically extracts the schemata from structured (e.g., relational) and semi-structured (e.g., JSON) data sources and translates them into a canonical data model. To that end, a set of production rules parse their metadata and generate source graphs and provenance graphs (PG). These allow to describe the integration of a particular set of data sources, capture the results of bootstrapping the sources and aligning their schemata. Thus, PGs are used to generate specific constructs of a given integration tool.

Strategic Dashboard. The Strategic Dashboard is a modular, configurable and extensible software analytics tool used in Agile Software Development projects in order to improve the software development process and the quality of the software produced. It enables decision makers to define their own Quality Model, composed of quality-related Strategic Indicators, decomposed in their turn into Quality Factors related to system development and usage, and Quality Metrics. The Strategic Dashboard automatically performs a quality assessment of the quality model defined. Raw data is collected from multiple sources of information, such as development tools (e.g., JIRA, Github), and the usage of the software from end-users (e.g. software logs). The quality assessment enables the strategic dashboard to perform several analyses that are provided to the Decision Maker, such as visualization, what-if analysis, forecasting, and semi-automatic generation of new requirements in response to alerts when some quality model element drops below unsatisfactory levels of quality.

Justification
Despite the benefits ODIN provides in terms of data integration, its query interface is rather limited to technical users that are familiar with semantic web technologies. Thus, there is a gap between such a low-level interface and the advanced capabilities that decision makers need in their organizations (e.g., progress indicators, what-if analysis). Here is where the Strategic Dashboard comes into play. Organizations want to be able to base their decisions on the latest set of available data, which requires a product that combines both (i) exploratory data analysis to select, navigate and discover variables of interest; and (ii) support decision making via analytical dashboards. This project proposes to adapt and integrate these two independent tools, ODIN and the Strategic Dashboard, into a unified product called D3M (Data-Driven Decision Making) bringing together the benefits of them both: (i) enabling the integration of disparate data sources in an incremental manner and (ii) provide advanced support on top of them for decision making processes via advanced dashboard interfaces.
The proposed architecture for the proof-of-concept D3M is shown as follows.

Project objectives
Transfer ODIN and the Strategic Dashboard, two independent components developed, evolved, customized and evaluated in GENESIS, into D3M, an integrated software product facilitating the adoption of data-driven decision making. D3M aggregates objective and qualitative pieces of evidence coming from disparate heterogeneous data sources into strategic indicators to support decision making in a largely automated manner, while enabling data exploration for data wranglers.
We break down the goal of the project into the following general objectives:
O1: Data-driven semi-automatic bootstrapping. To provide means to enable an incremental semi-automatic extraction of the domain ontology from a set of heterogeneous and independent data sources.
O2: Integrated data exploration interface. To enable data wrangling tasks (navigational queries on tabular and semantic data) from heterogeneous data sources federated through a domain ontology.
O3: Customized decision making support. To enable the creation of an advanced dashboard that spans heterogeneous data sources, by applying domain-specific quality models in order to assist decision makers.
O4: Unified product to support the end-to-end decision making process over heterogeneous data sources. To integrate the results of O1-O3; i.e., features for incremental bootstrapping of the domain ontology and data sources, and its exploitation: decision-making support based on strategic indicators and data exploration based on data wrangling.
O5: Incremental technology transfer of the proof of concept. Execute a technology transfer plan to assure an incremental evolution of the maturity (TRL) level of the developed software components for D3M via validation and demonstration of the proposed proof-of-concept (use cases).
O6: Assessment of the viability of the proof of concept. Perform a market analysis to assess the technical, commercial, and social viability of the proposed product, and uncover evolutionary paths for D3M becoming a product adapted to current and anticipated industry needs.
O7: Long-term sustainability of the proof of concept. Cultivate a broad network of industry and public sector contacts for both creating awareness and attract prospective customers.
O8: Intellectual property right assurance. Develop a strategy for managing the intellectual and industrial property rights of the developed proof of concept.
O9: Endorsing the project team with entrepreneurship skills. Define a training plan with a list of entrepreneurship courses and monitor its execution.
Share: